Classifier benchmark
Measure what your classifier choices add to each request before you change a policy.
What it is
A benchmark sends a built-in set of sample prompts through your real classifiers at increasing numbers of simultaneous requests. It reports the wait with nothing else running, the typical and 95th-percentile wait at each level, classifier calls per request, and the most simultaneous requests that stay within a latency budget you set.
Why you want it
Guards and inline labels add latency that depends on the model, the server and how questions are grouped. Measuring it on your own hardware replaces guesswork when choosing classifiers.
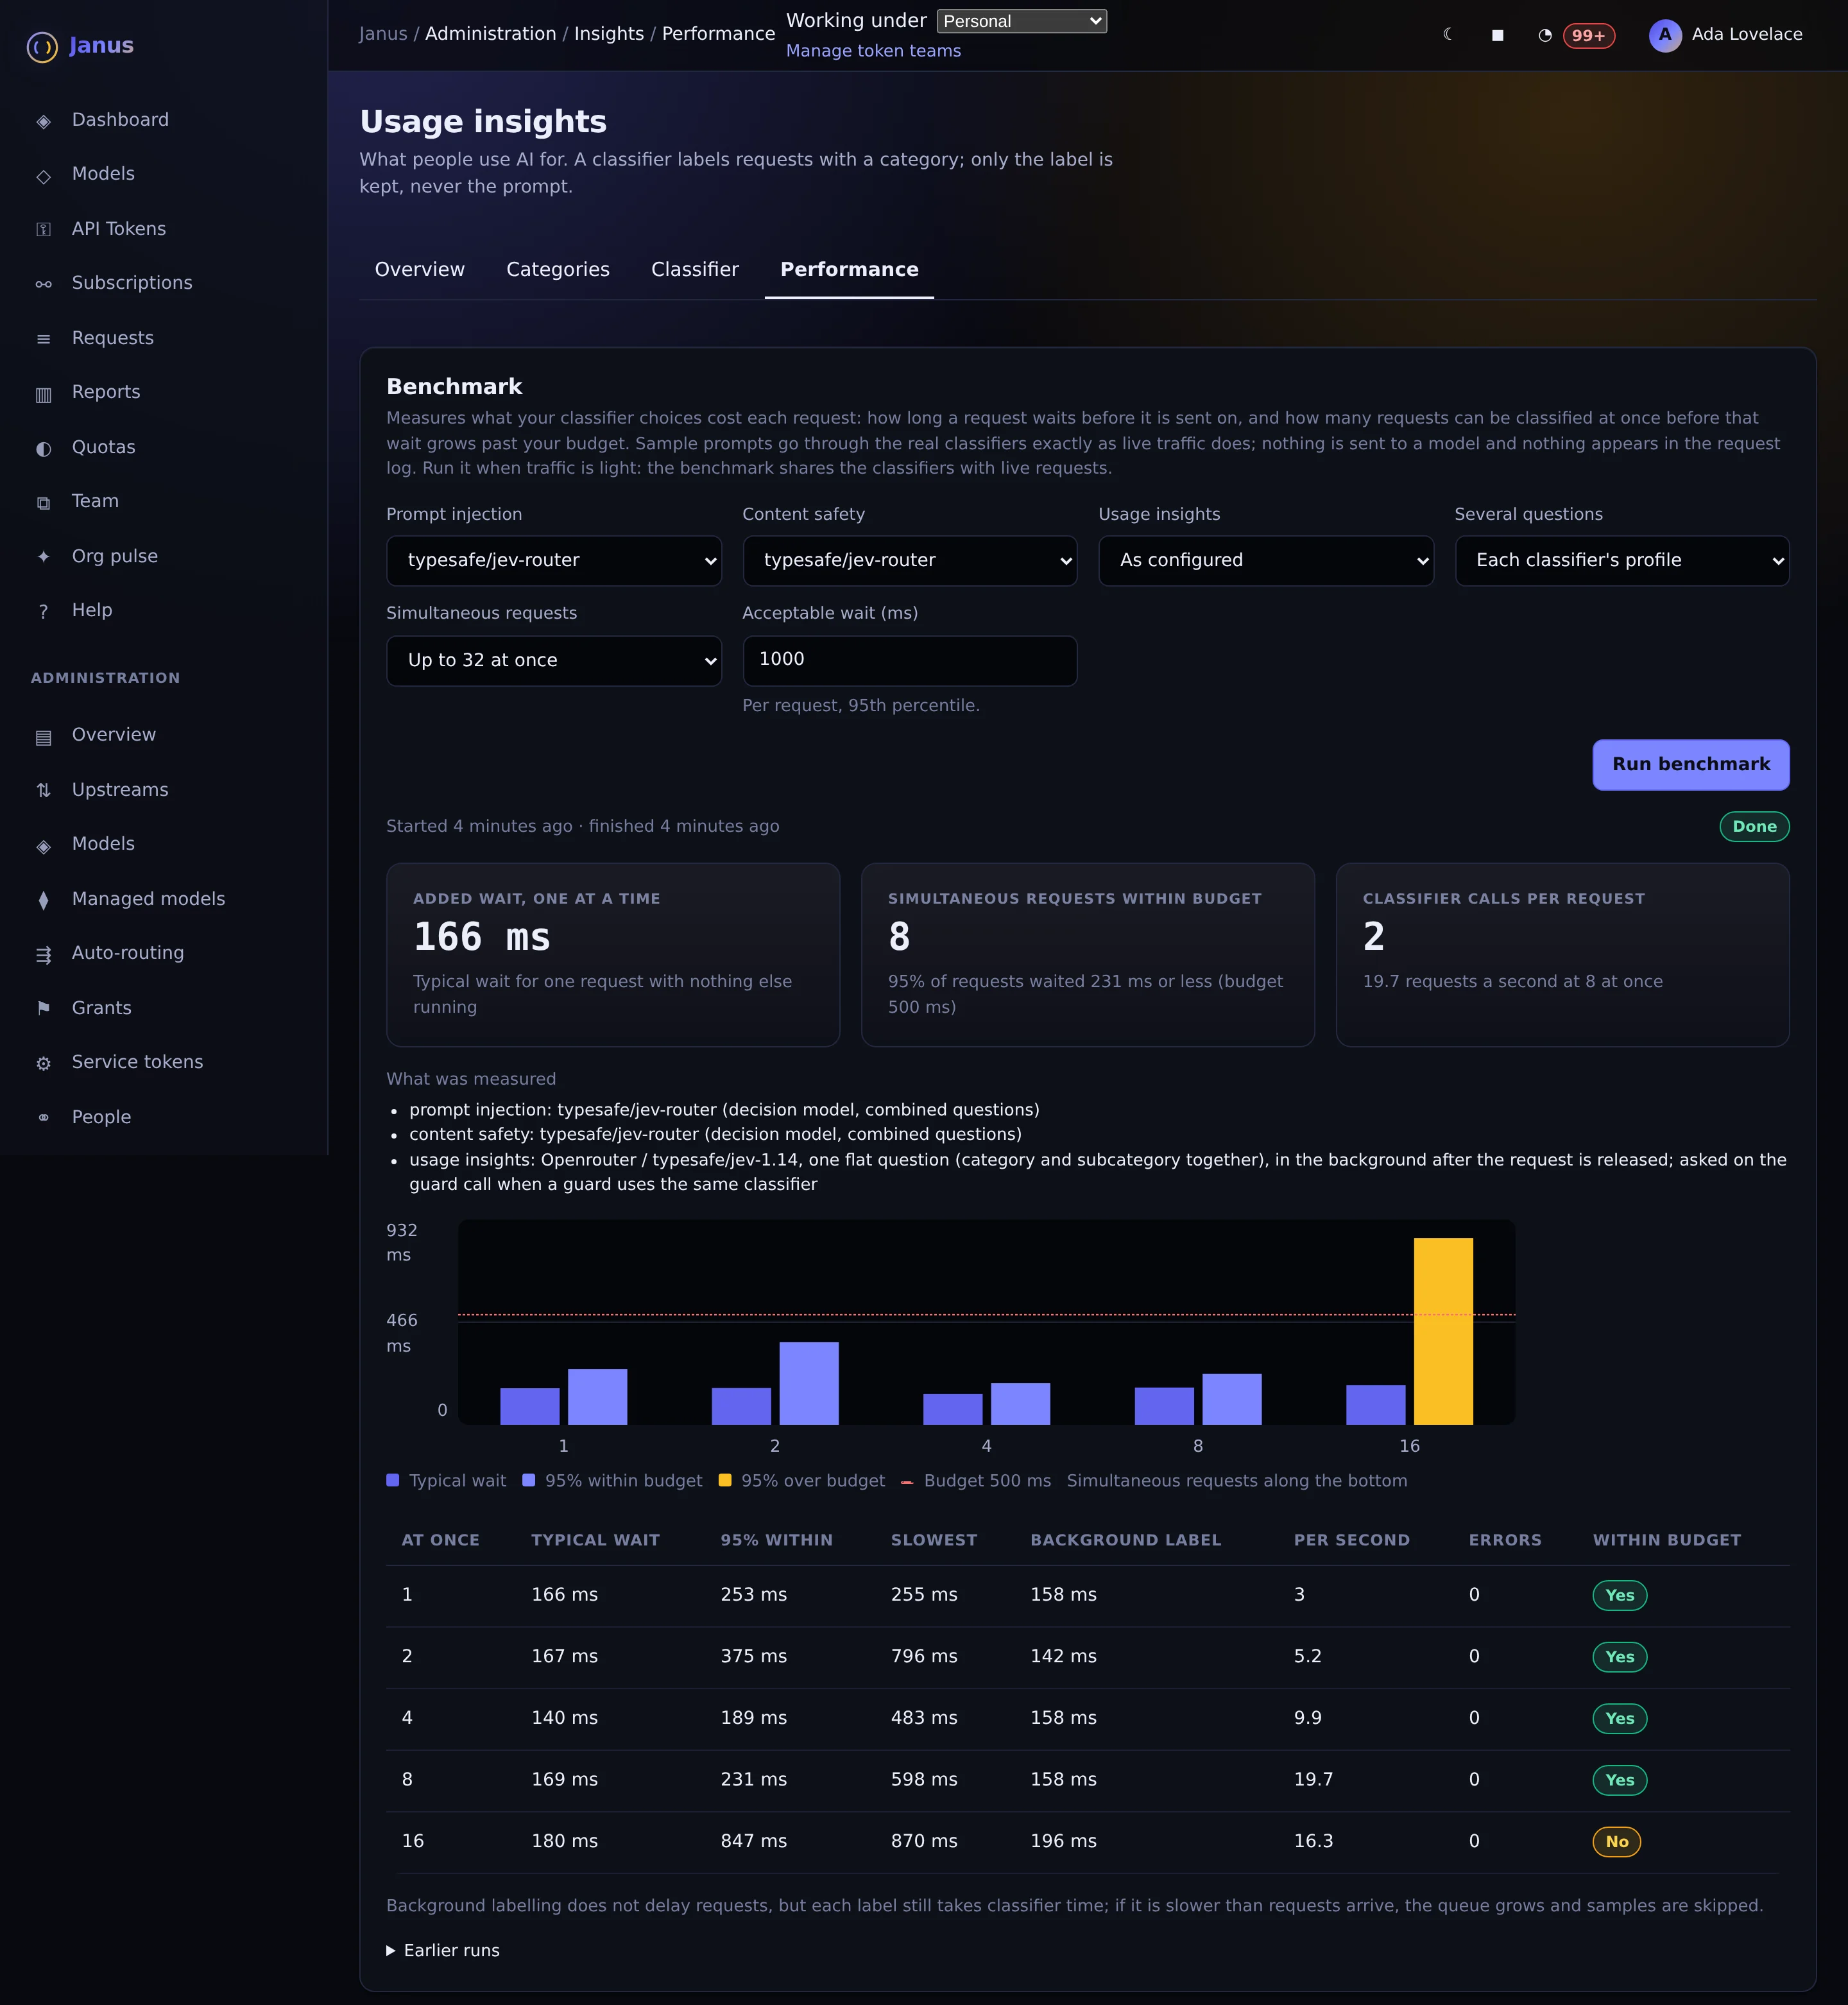
The wait guards and labels add at each level of simultaneous requests, measured against a latency budget.
Actual Janus interface · Demo identities and synthetic usageHow it works
- Under Usage insights, Performance
- Nothing is forwarded to a model or written to the request log
- Uses its own circuit breakers, so it can't trip the breakers live traffic depends on
- One benchmark runs at a time across replicas
In the product
Screenshot above. Actual Janus interface with demo identities and synthetic usage.
See it on your own network.
The Community edition is free for up to 25 people. The 30-day Business trial unlocks every Business feature.