Dashboards and reports
Dashboards for everyone
Personal, team, organization and admin dashboards for requests, tokens, spend, cache and throughput.
What it is
Personal, team, organization and admin views of requests, tokens, spend, cache hit rate and throughput over time.
Why you want it
People can see their own usage and limits, which cuts support questions, while admins get the org-wide picture.
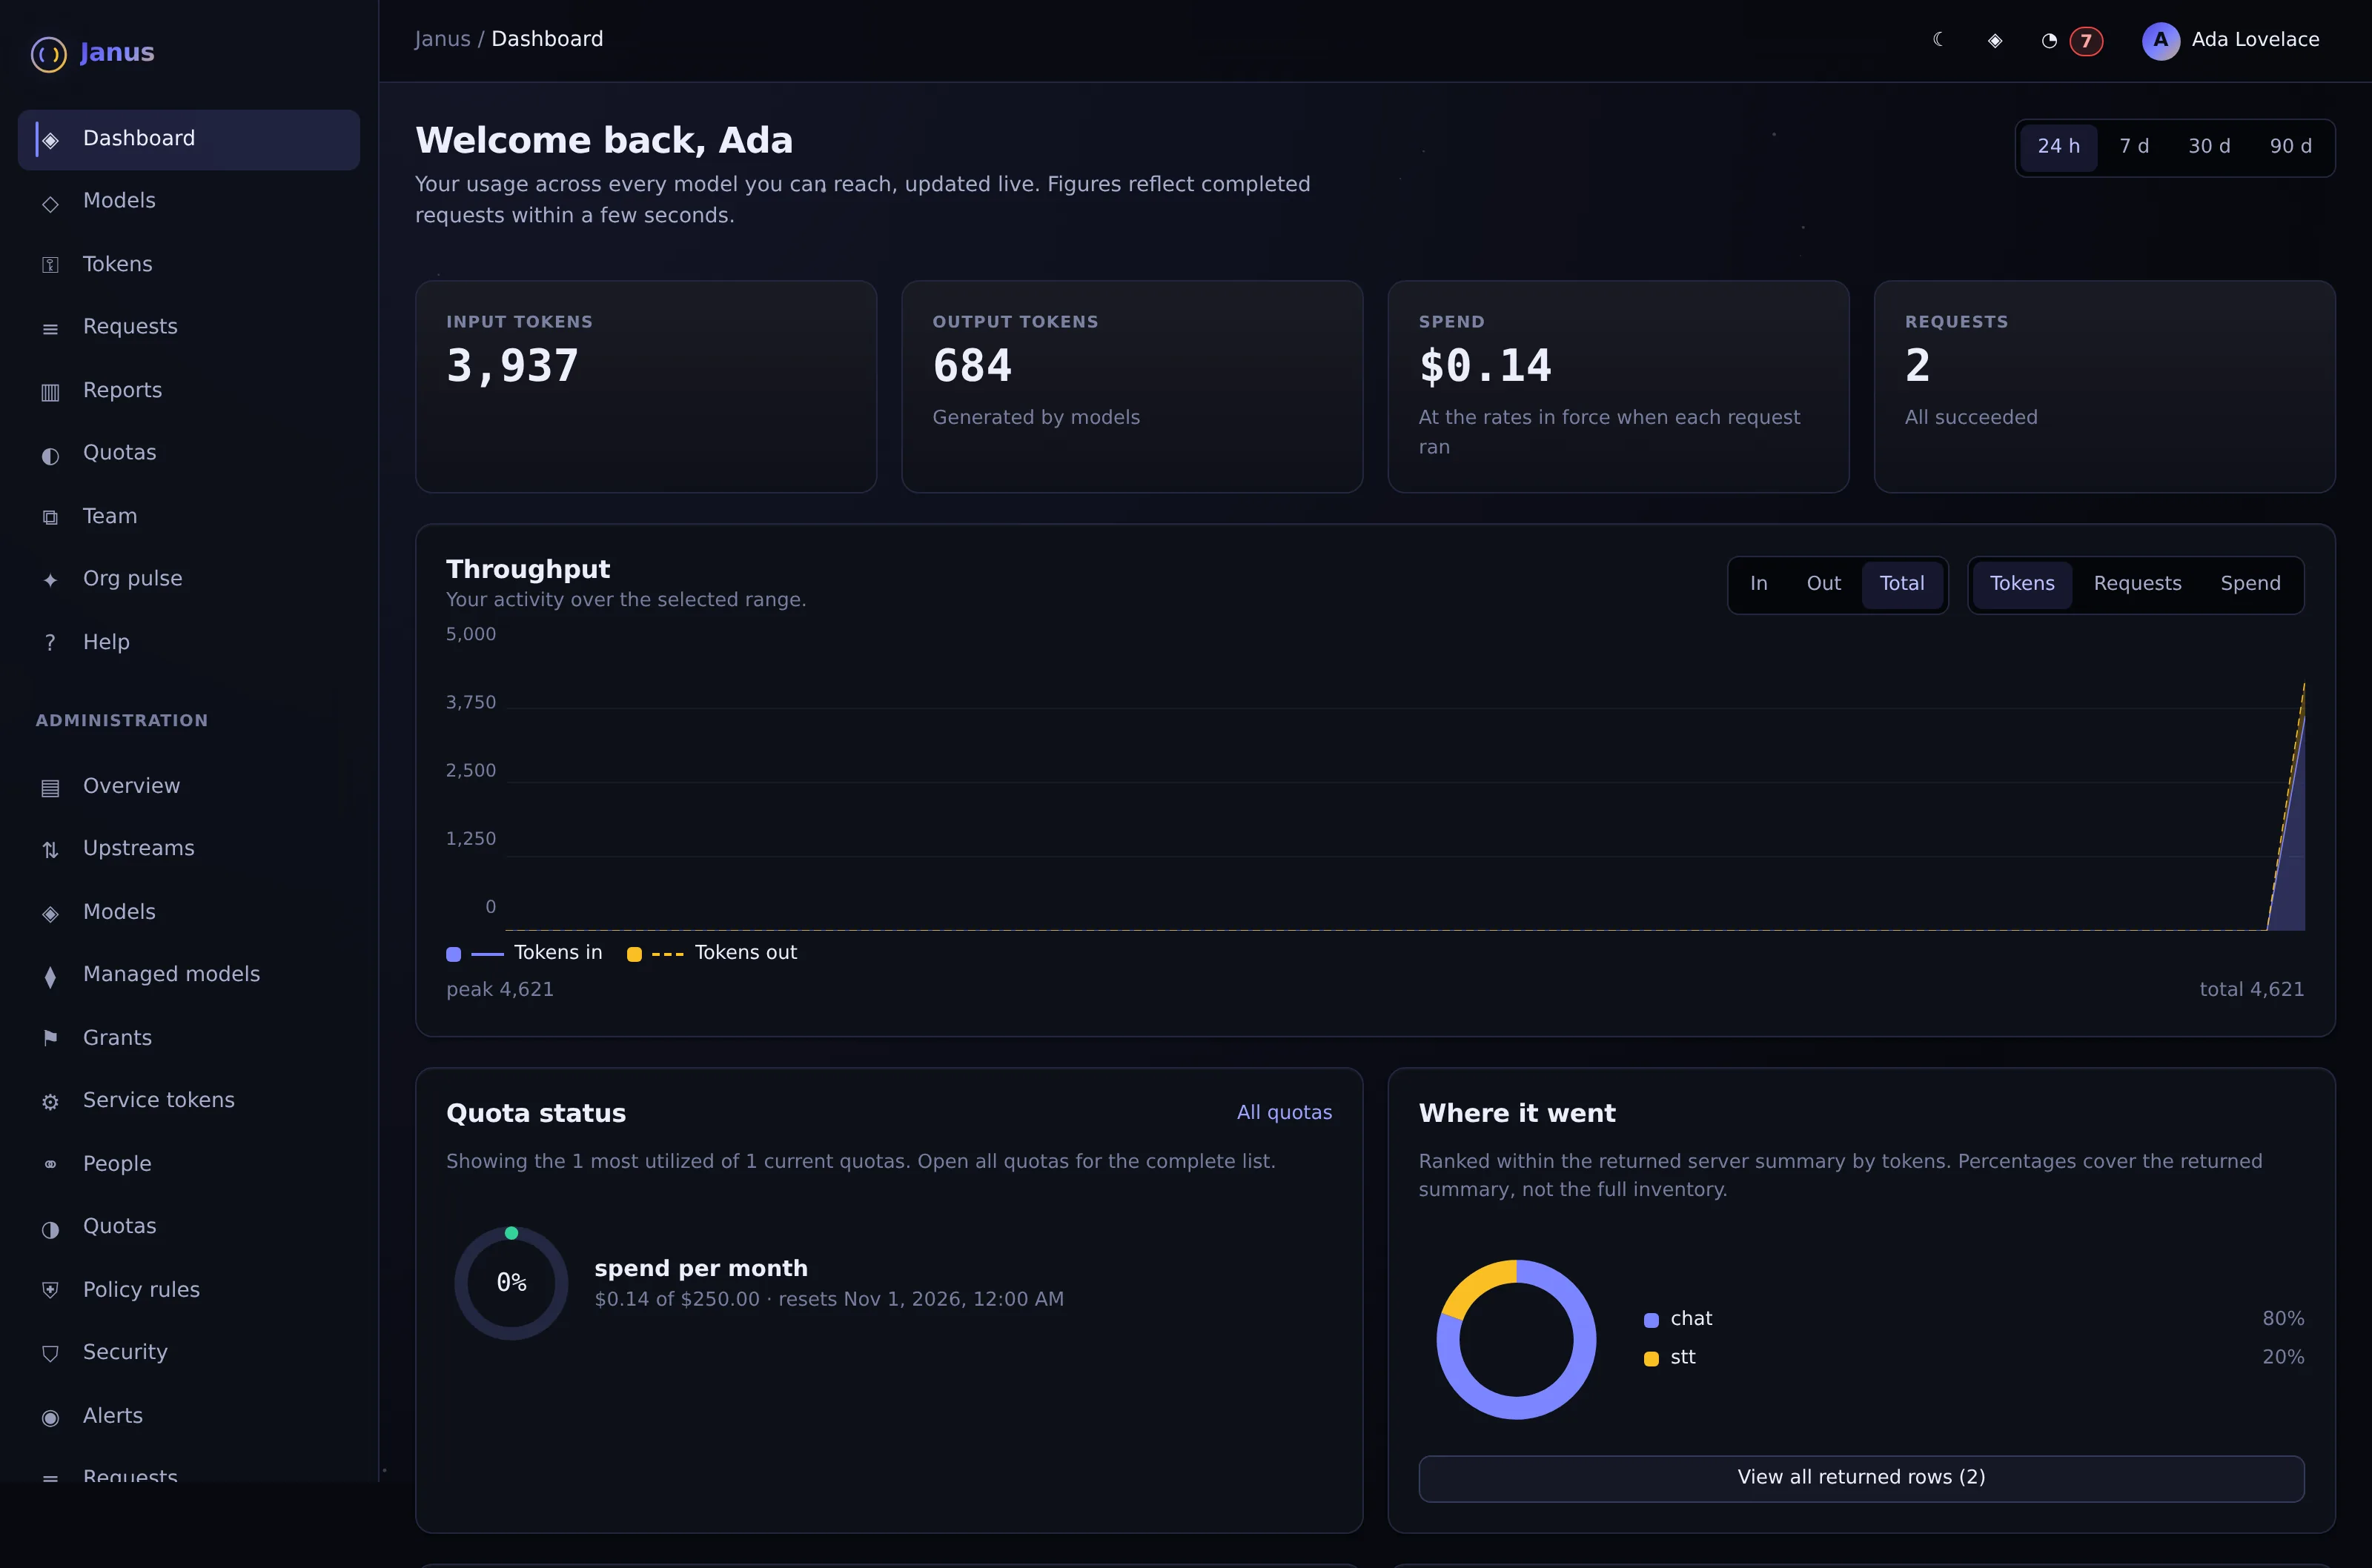
A person's own tokens, spend, requests, quota and where their usage went.
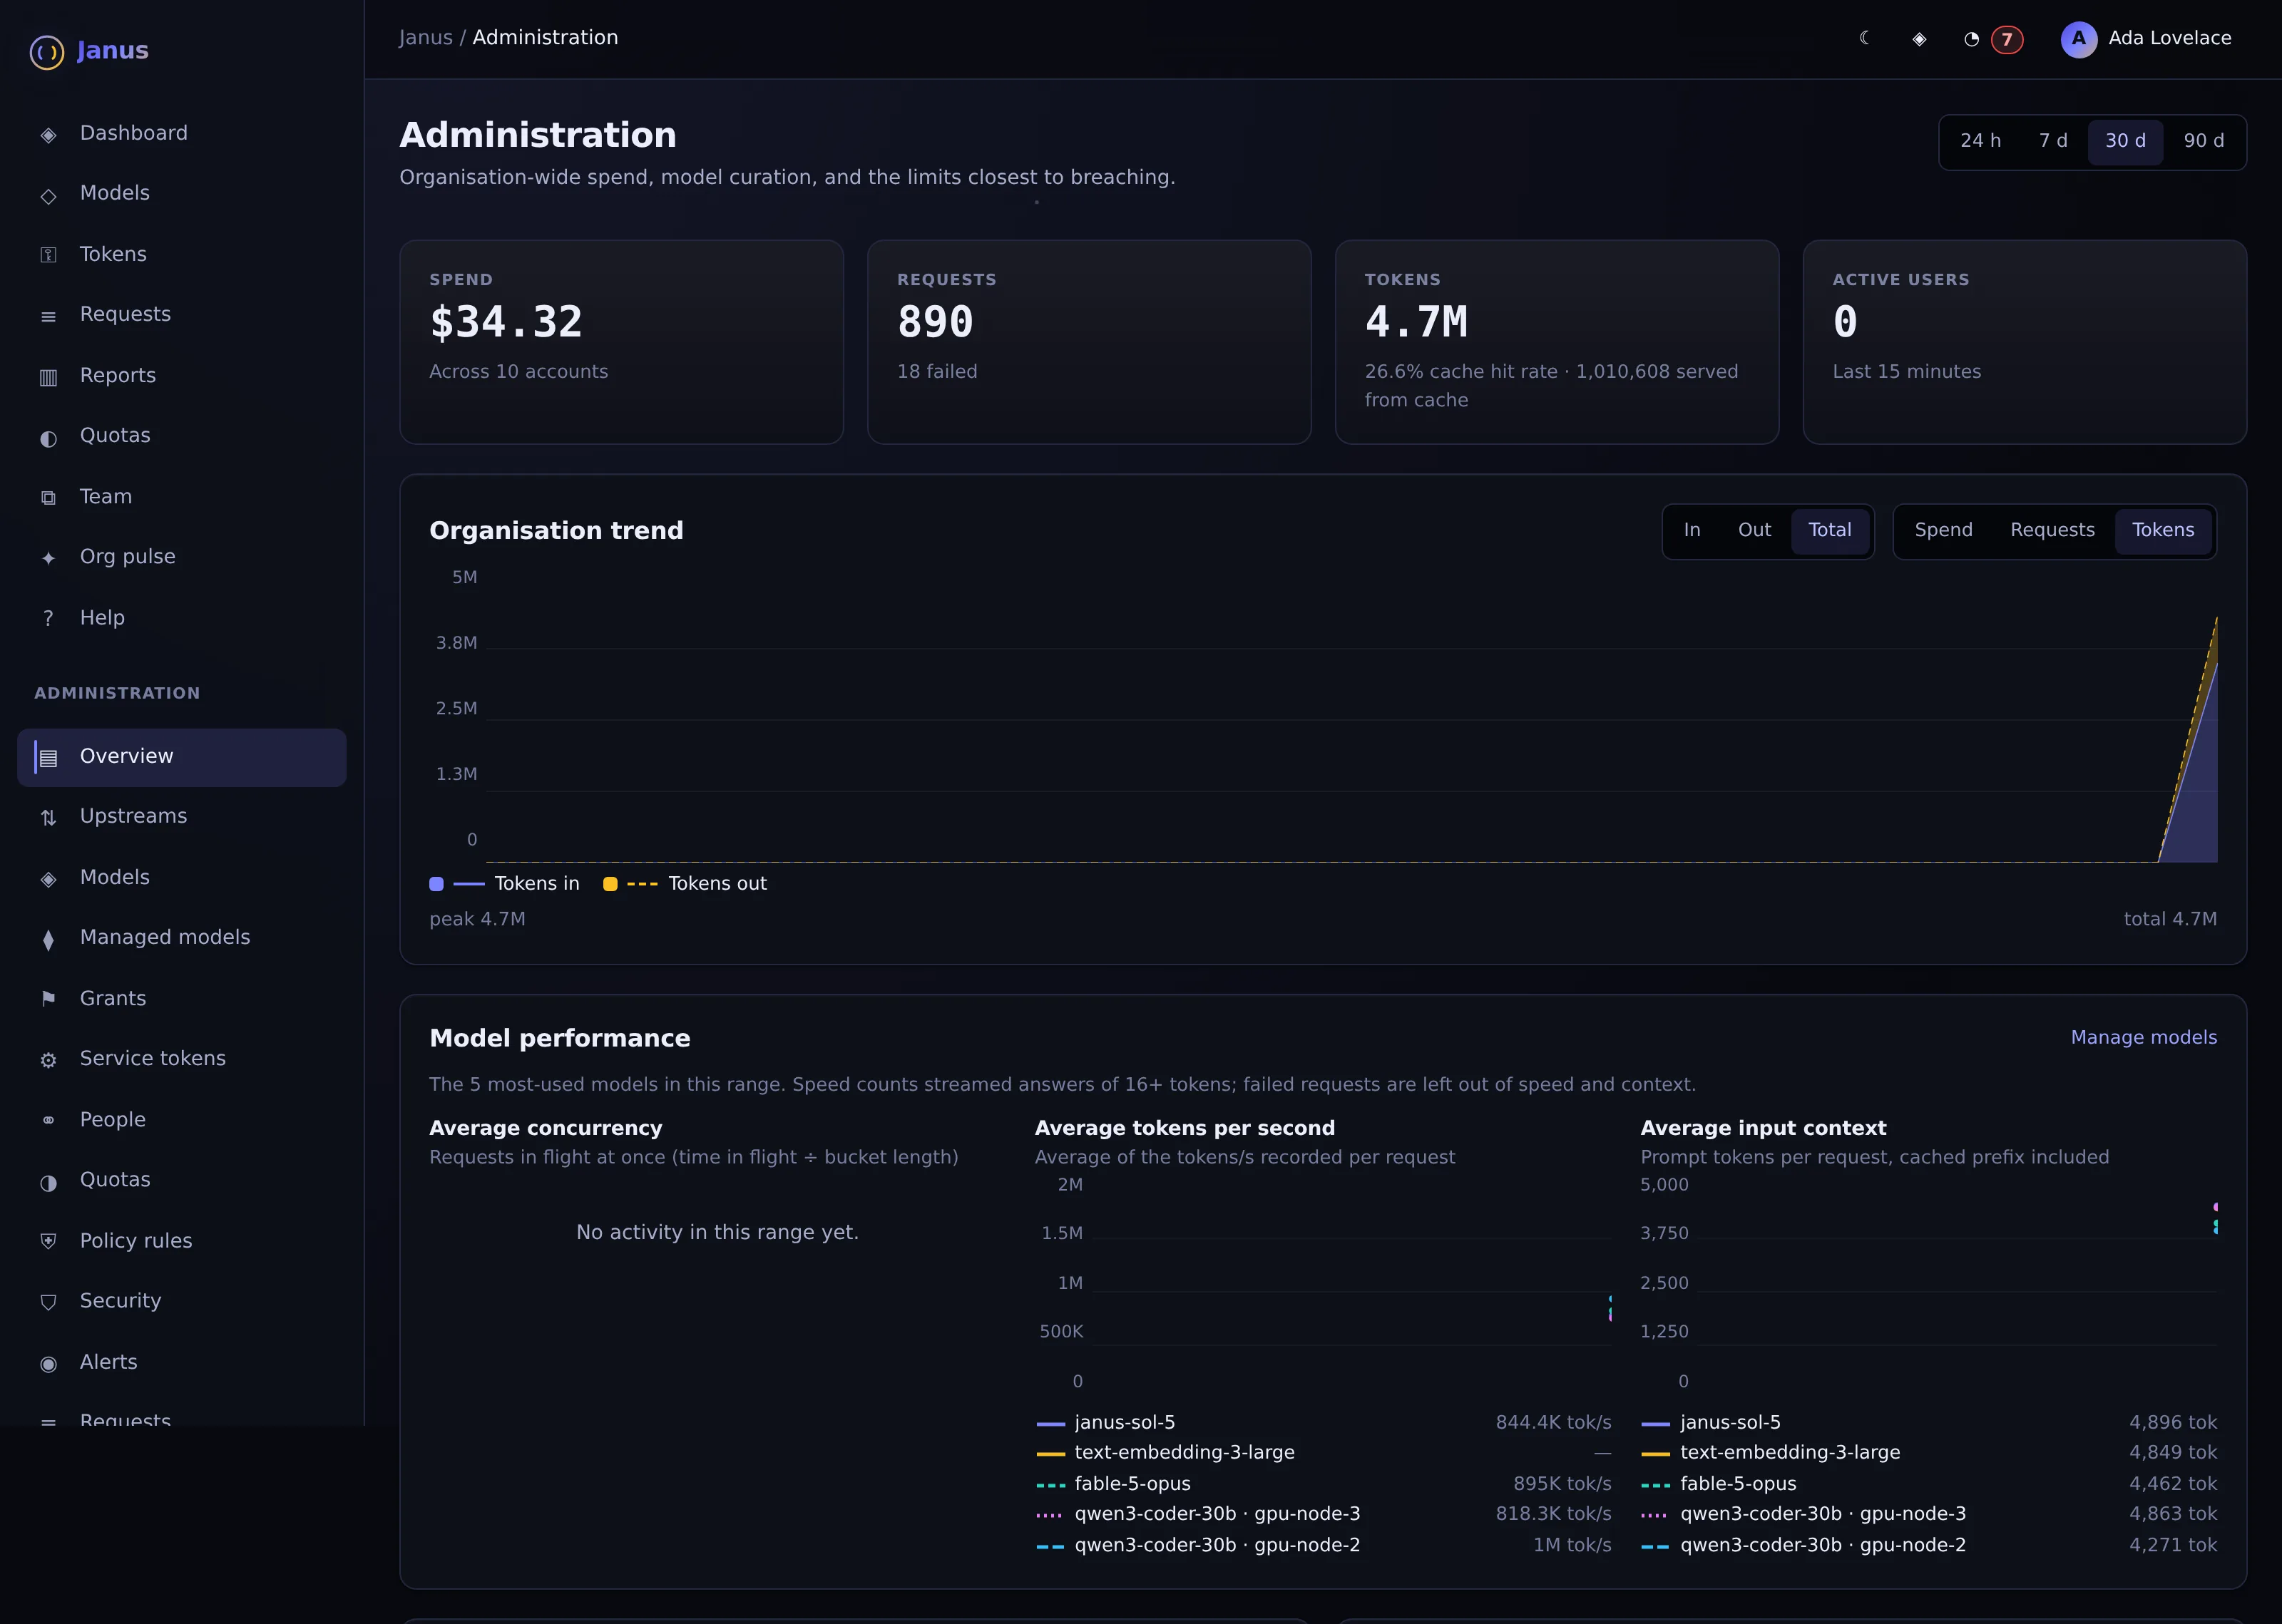
Actual Janus interface · Demo identities and synthetic usageHow it works
- Org pulse with live throughput and in/out token split
- Admin Overview with top people, teams and service tokens, automated vs human split, and model performance
- Spend or tokens emphasis and optional leaderboards are runtime flags
- Sorts and filters live in the URL so views are shareable
See it on your own network.
The Community edition is free for up to 25 people. The 30-day Business trial unlocks every Business feature.