Dashboards and reports
Request log with CSV export
Find the exact request behind a failure or a cost spike with filters, a detail view and CSV export.
What it is
Everyone can browse their own requests, and administrators can browse every request with filters for person, service token, model, modality, outcome and token size.
Why you want it
When something fails or costs too much, the exact request is a filter away, without prompts ever being stored.
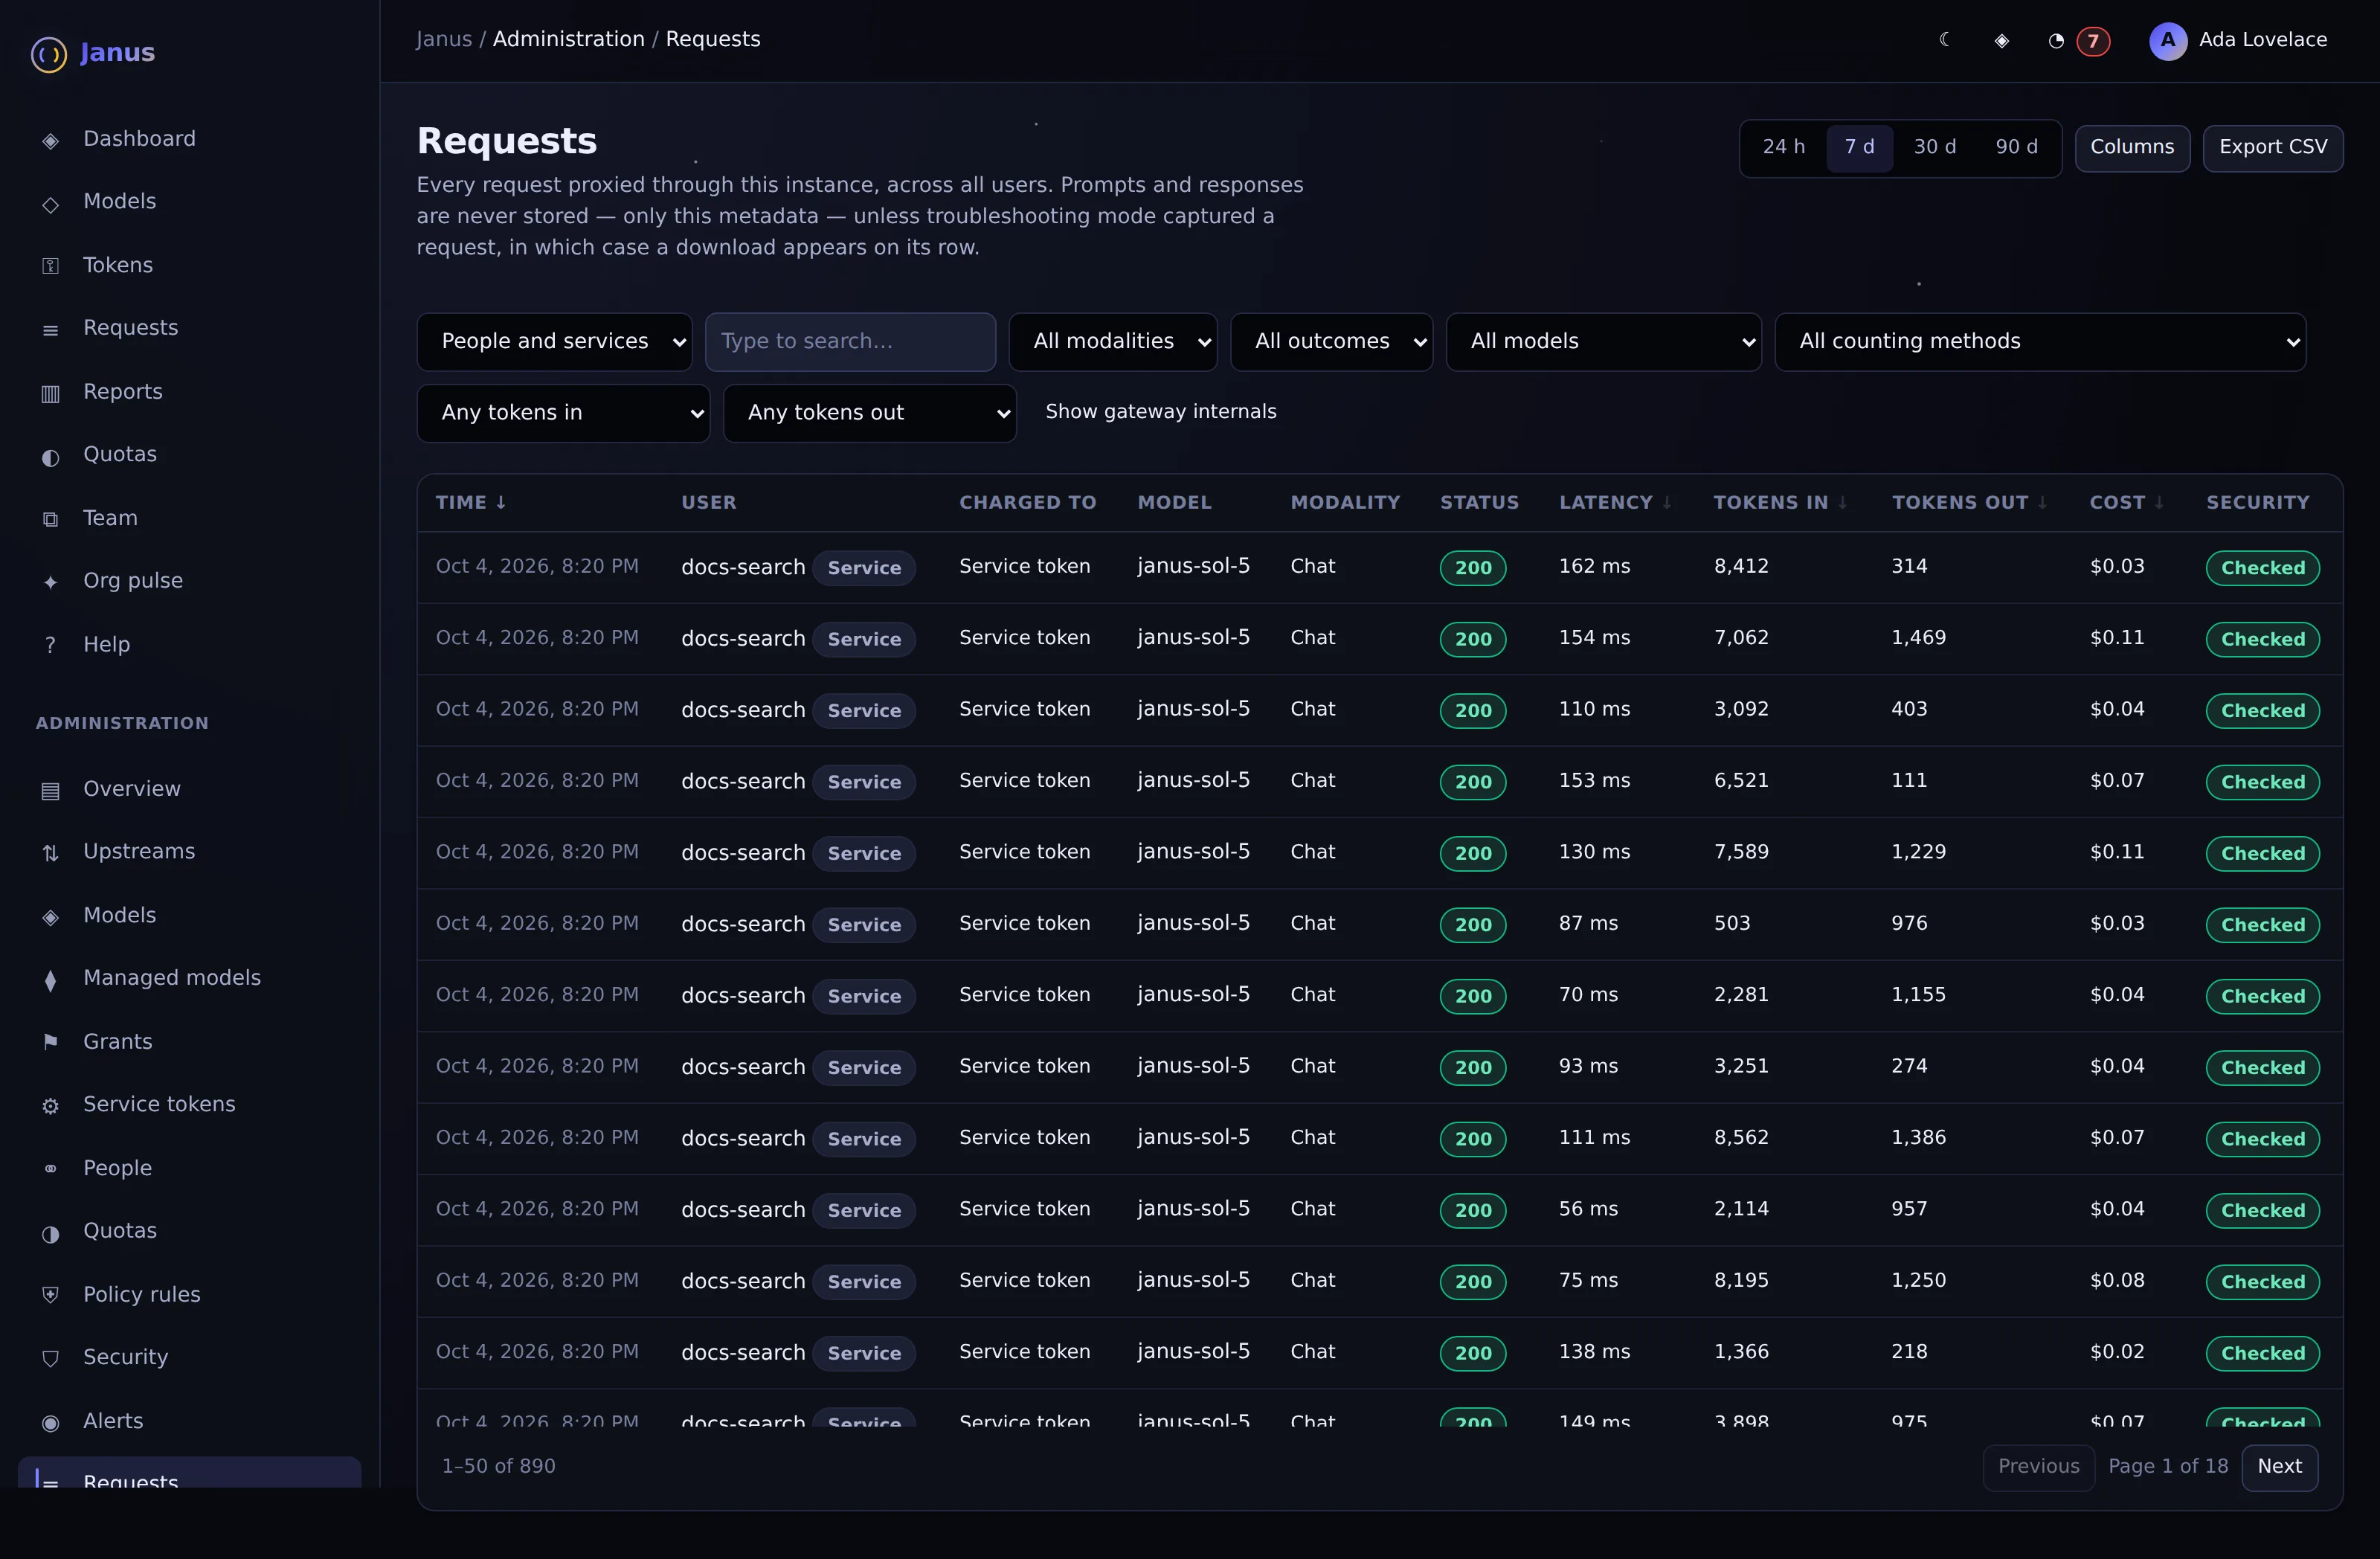
Every request with who sent it, who was charged, the model, status, latency, tokens, cost and security outcome.
Actual Janus interface · Demo identities and synthetic usageHow it works
- Column picker remembers choices; detail drawer shows tokens, cost, timing, fallback and security actions
- CSV export follows the active filters, up to 5,000 rows with an explicit truncation marker
- Admin view can filter by people, service tokens or both
In the product
Screenshot above. Actual Janus interface with demo identities and synthetic usage.
See it on your own network.
The Community edition is free for up to 25 people. The 30-day Business trial unlocks every Business feature.