Models, providers and routing
Model speed and activity
Model cards show real tokens per second and jobs per day, so people pick fast models and you spot overloaded ones.
What it is
Model cards show tokens per second and jobs per day with a trend arrow. The admin Overview charts concurrency, speed and input size for the busiest models.
Why you want it
Users can pick a fast model, and admins can see which models are overloaded or idle before buying more capacity.
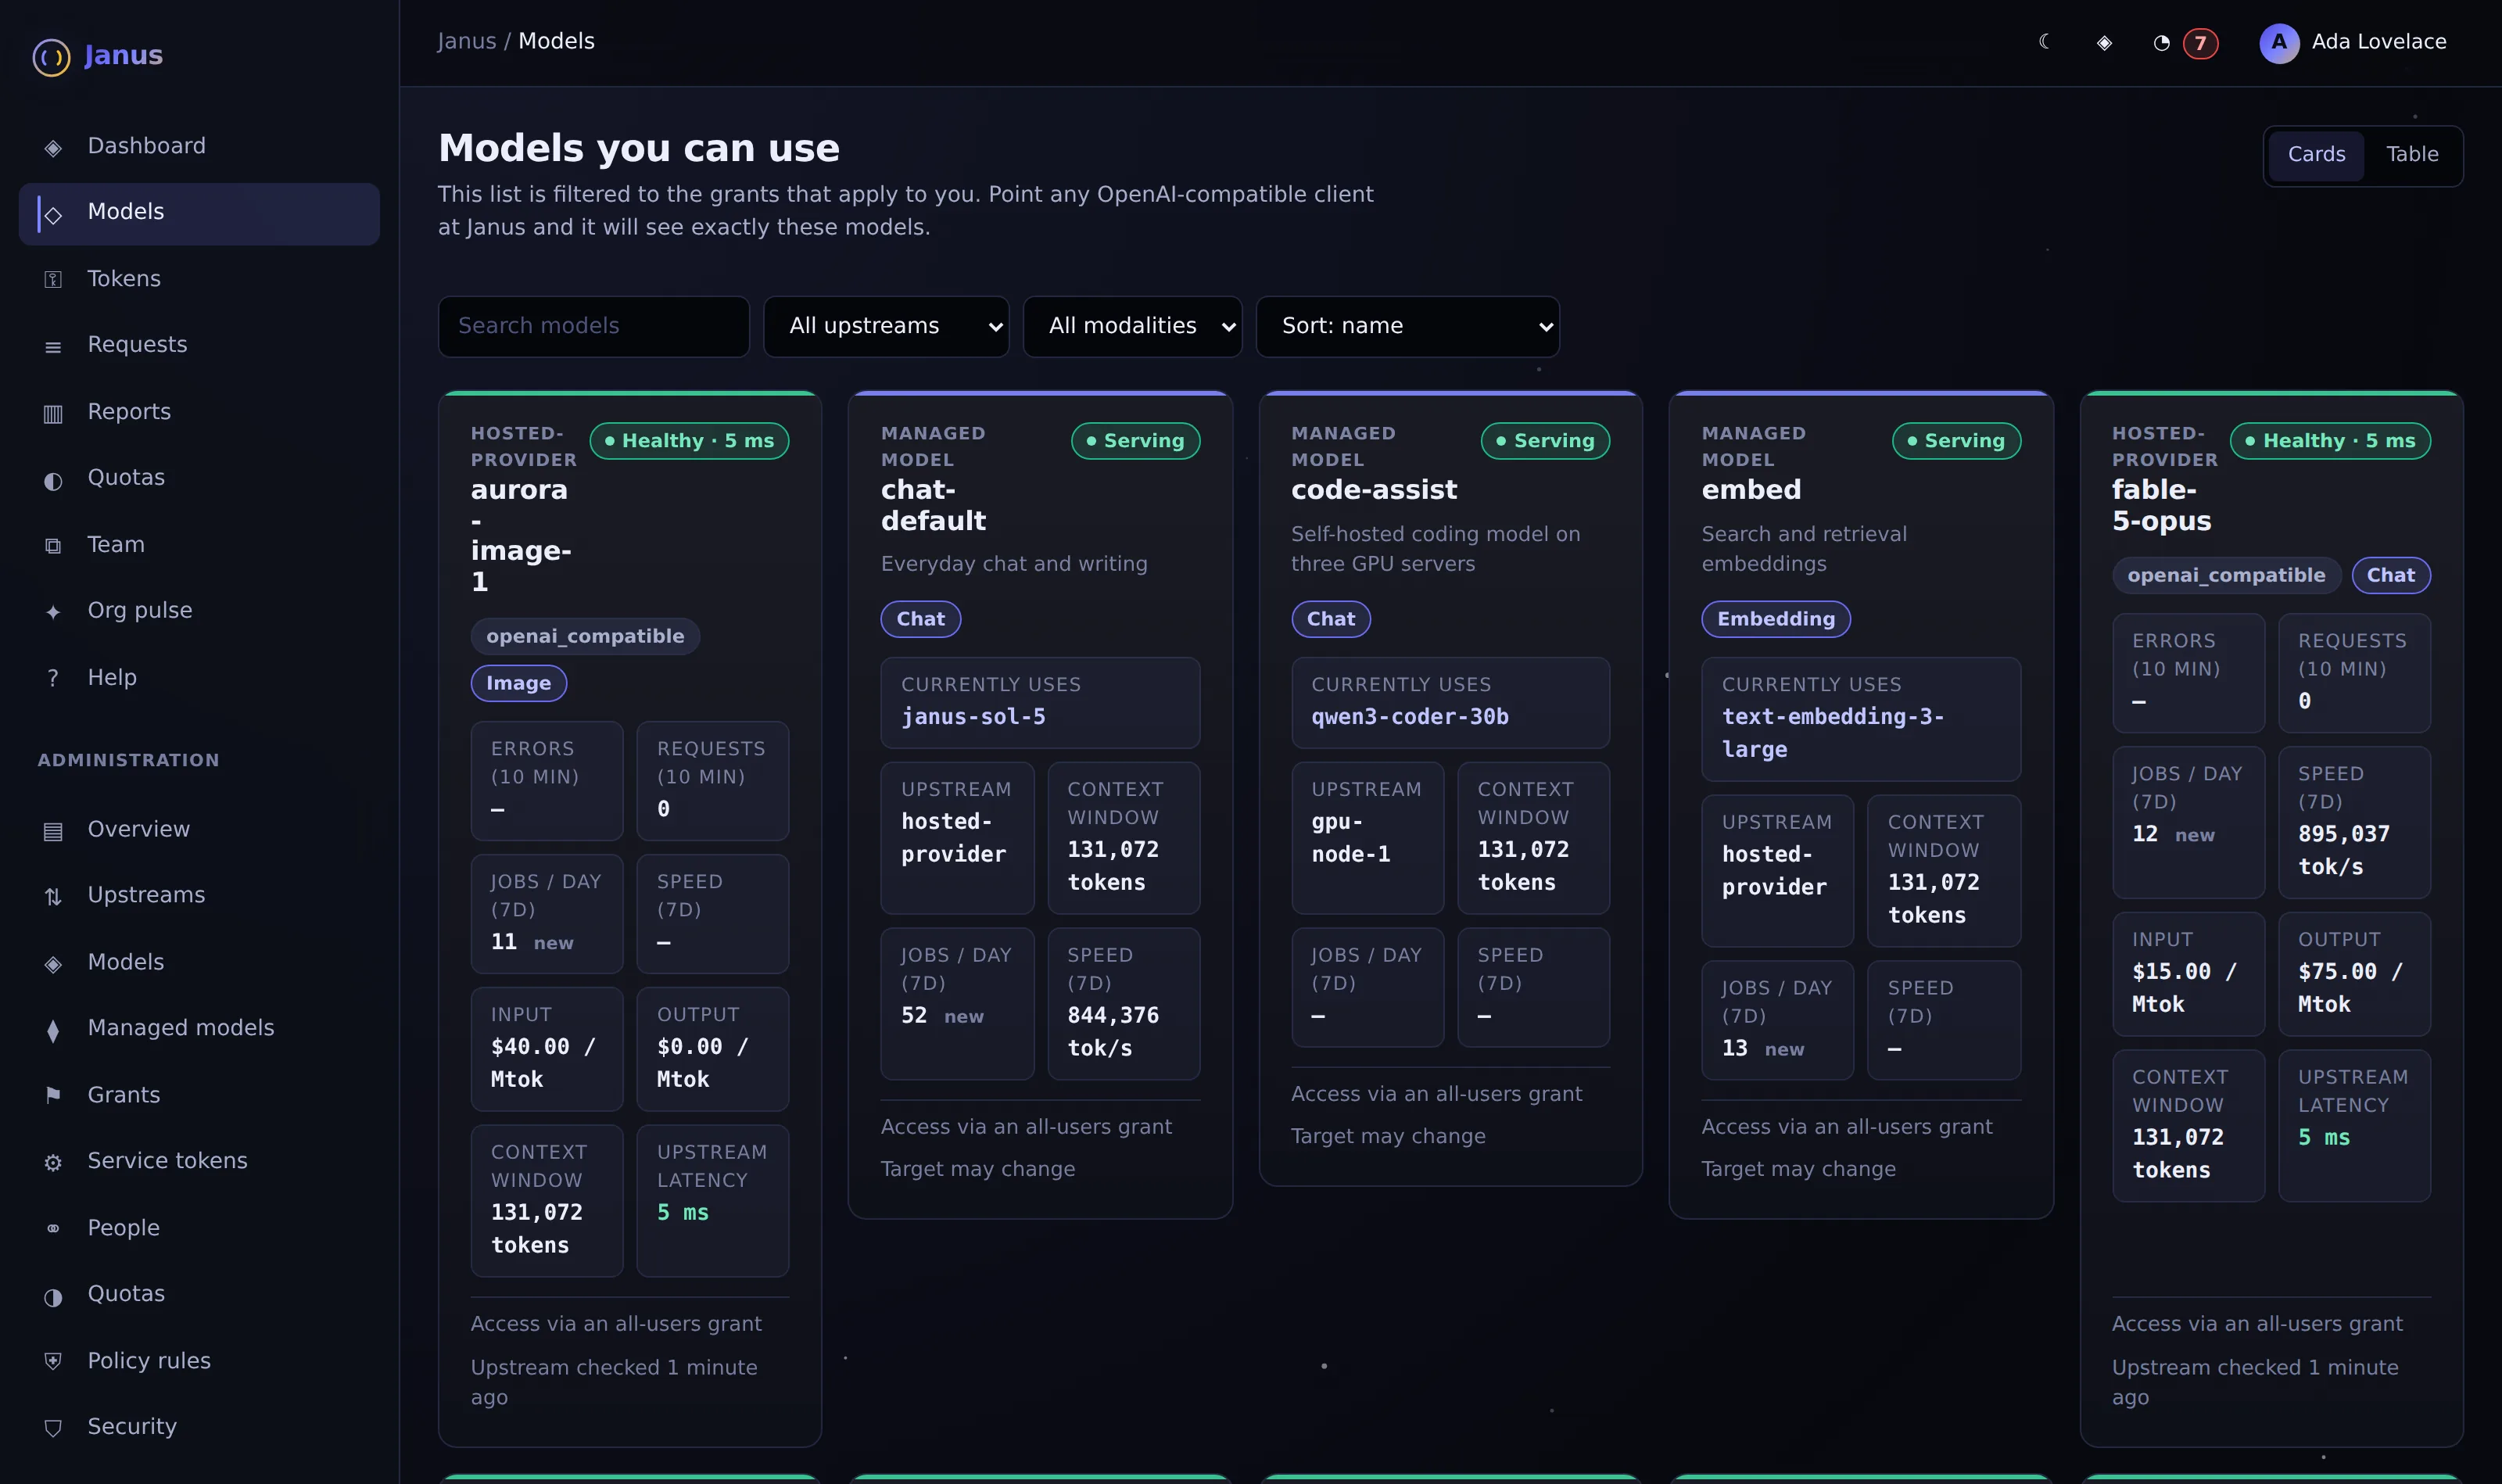
The models each person may use, with health, speed, price, context window and recent activity.
Actual Janus interface · Demo identities and synthetic usageHow it works
- Every response carries X-Janus-Tokens-In/Out-Per-Second, or X-Janus-Calculated-* when Janus had to estimate
- Engine-measured speeds (vLLM per-request metrics, llama.cpp timings, Ollama durations, Groq timings) are preferred
- Prompt-cache hits are excluded from input speed
- Speed averages successful answers of 16 or more tokens over 7 days
In the product
Screenshot above. Actual Janus interface with demo identities and synthetic usage.
See it on your own network.
The Community edition is free for up to 25 people. The 30-day Business trial unlocks every Business feature.